NeuroFlow
A self-contained, browser-based workflow that takes mouse brain sections from raw histology images to region-resolved counts, registering each section to the Allen Mouse Brain atlas and quantifying labeled signal per brain region, entirely on your own computer.
Video tutorial
A complete walkthrough of the pipeline, from loading raw section images through registration, signal detection, and regional quantification. Follow along in a second tab with your own data.
What it does
Mapping histological sections onto a common reference atlas is an essential but usually fiddly step in neuroscience: existing workflows are powerful, yet an analysis often spans several programs, operating-system-specific components, or specialized software dependencies. NeuroFlow brings the whole pipeline into a single web page that runs locally in your browser, and your images are never uploaded and there is no backend server.
It integrates section cropping, anterior–posterior ordering and coarse atlas-plane assignment, real-time 3D oblique atlas reslicing, affine and nonlinear registration, selected-color signal detection, atlas-based regional quantification, series-level aggregation, and interactive 3D inspection, all as one coherent, seven-stage pipeline. Major controls and intermediate results stay inspectable throughout, a project file preserves your section, registration, mask, and result state, and every stage can be exported to a spreadsheet.
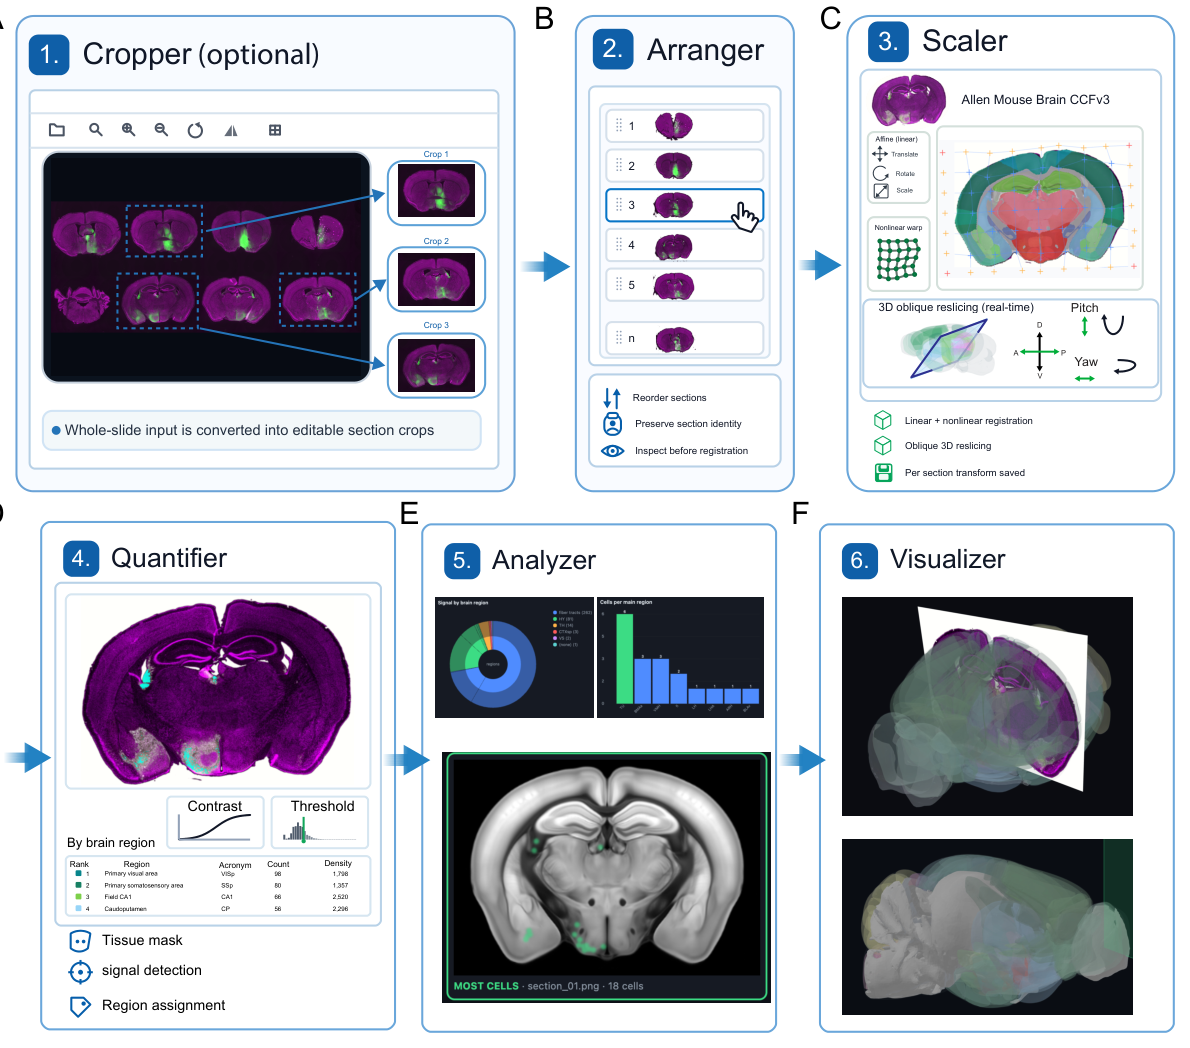
The seven-stage pipeline
Cropper · optional
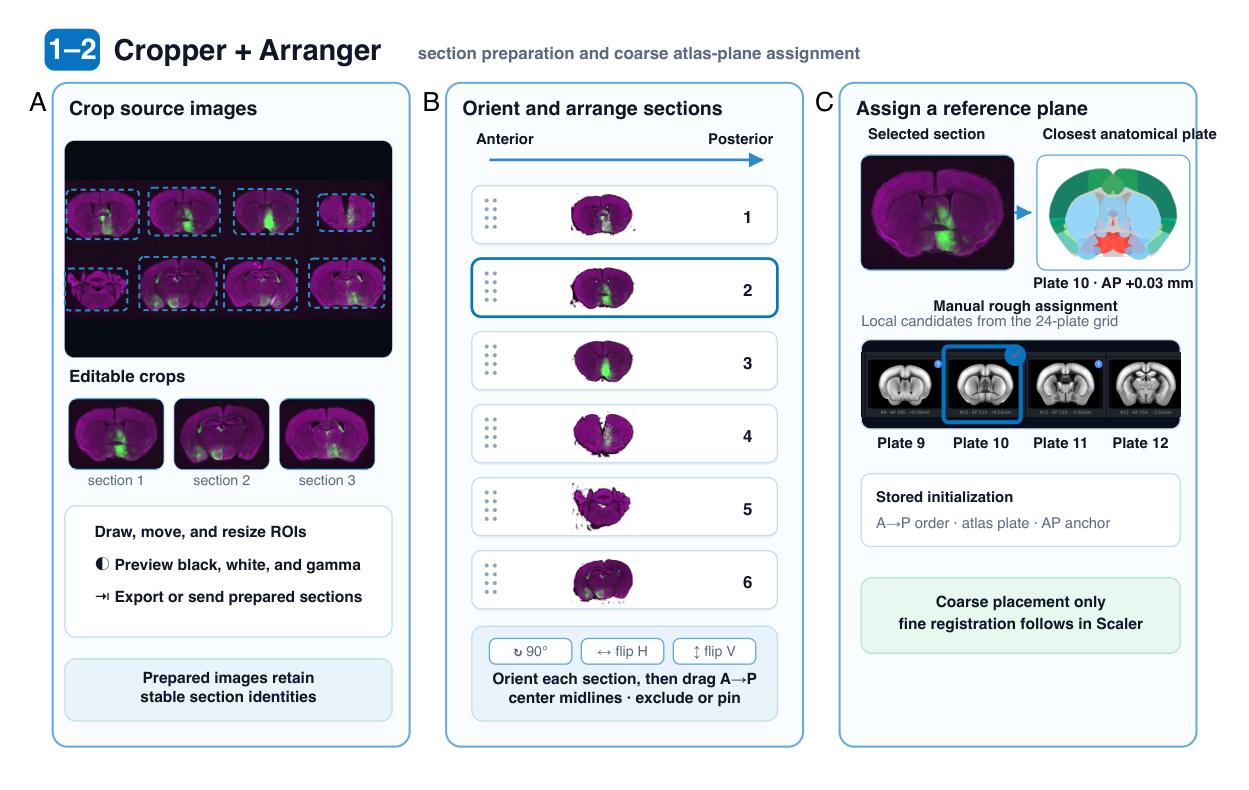
Turn a whole-slide or multi-section source image into clean, editable per-section crops. Draw, move, and resize regions of interest; preview black/white and gamma; and export the prepared sections, each keeping a stable identity so it can be tracked through the rest of the pipeline.
Arranger
Orient each section (rotate 90°, flip horizontally or vertically) and drag them directly into anterior-to-posterior order. Center midlines and exclude or pin sections as needed. Section identity is preserved so you can inspect the series before any registration.
3D Orienter · oblique planes
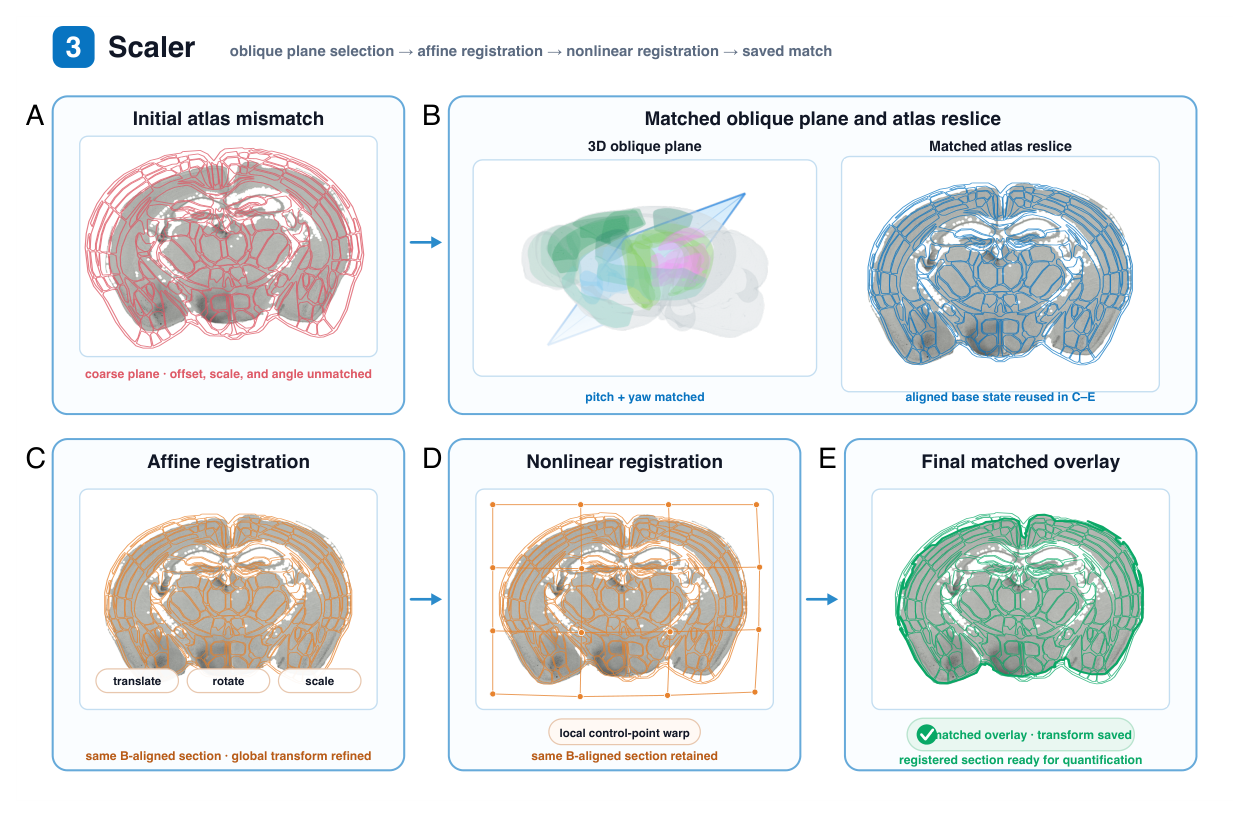
Set each section's true 3D cutting plane before any scaling. Sections matched to an atlas plate are sent here, where you tilt the plane directly (drag to tilt, shift-drag to resize), adjusting anterior–posterior depth, pitch, and yaw against a real-time oblique reslice of the atlas. Sections cut off-axis get an atlas plane that actually matches them, rather than being forced onto the nearest coronal plate.
Scaler · registration
Register each section to the Allen Mouse Brain CCFv3, working against the oriented plane from the previous stage. Refine with affine transforms (translate, rotate, scale) and then a nonlinear control-point warp for local alignment. Each section's transform is saved.
Quantifier · signal detection
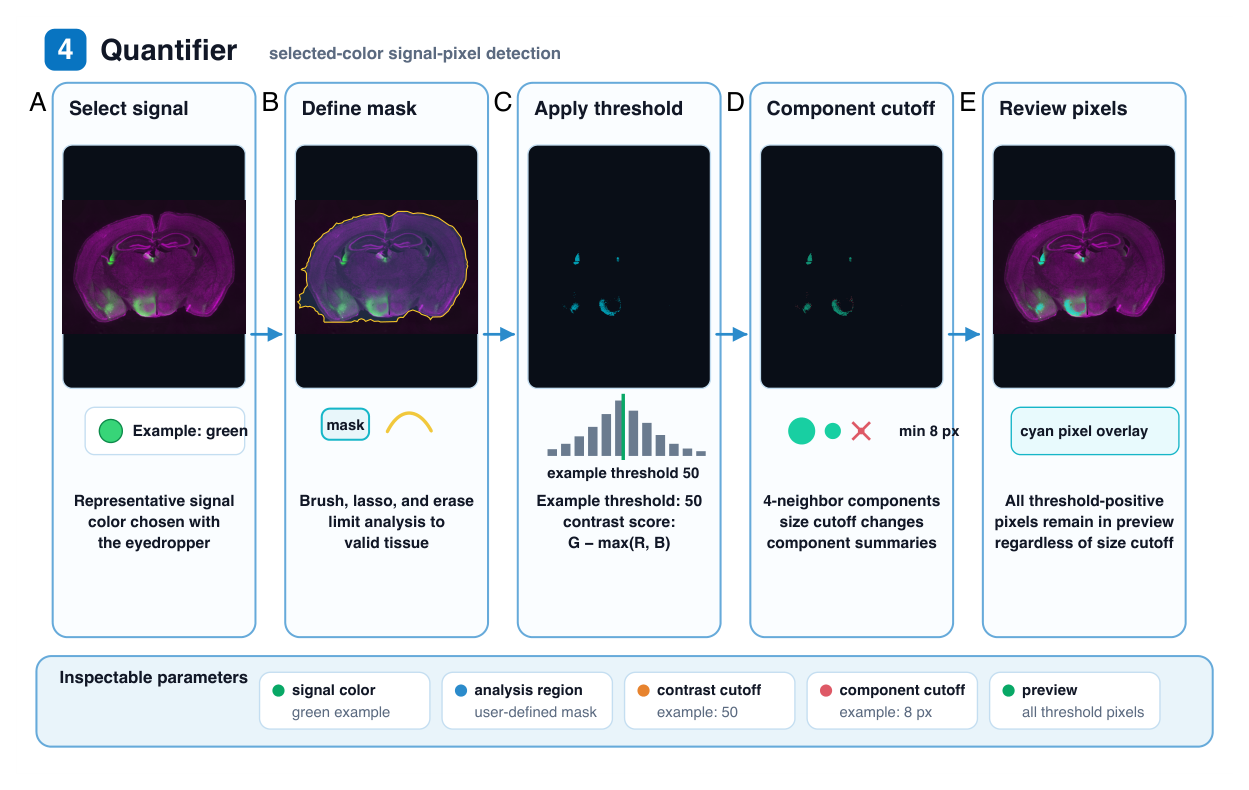
Detect labeled signal by color. Pick a representative signal color by typing it or sampling with the eyedropper, restrict analysis to valid tissue with brush/lasso/erase mask tools, then set a contrast threshold (for green, the score is G − max(R, B)) and a connected-component size cutoff. A cyan preview shows every threshold-positive pixel. NeuroFlow works from source-image pixels only. It does not invent cells or synthetic centroids.
Analyzer · regional quantification
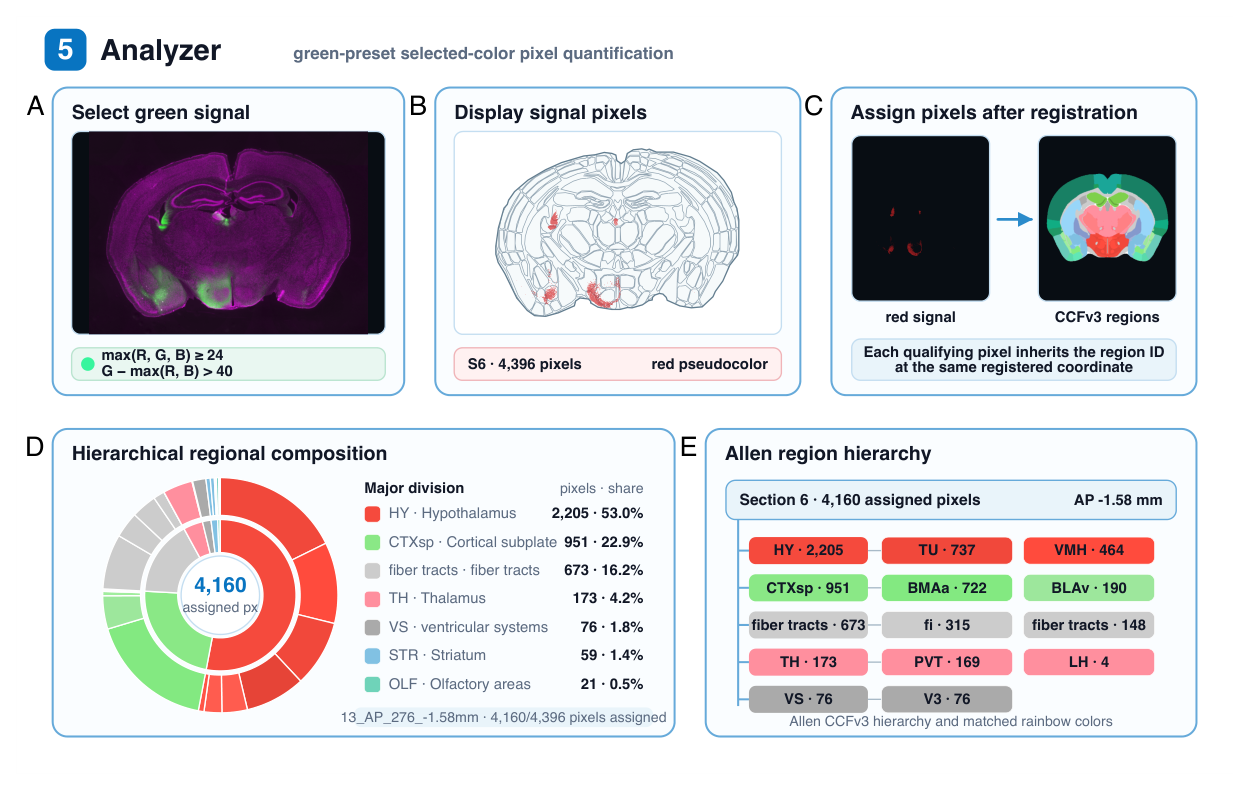
Turn detected pixels into region-resolved numbers. Each qualifying pixel inherits the CCFv3 region label at its registered coordinate, producing a ranked table of regions (acronym, pixel count, density), a two-level sunburst of major divisions and their constituent regions, and an Allen region-hierarchy tree. Results aggregate across the whole section series.
Visualizer · 3D inspection
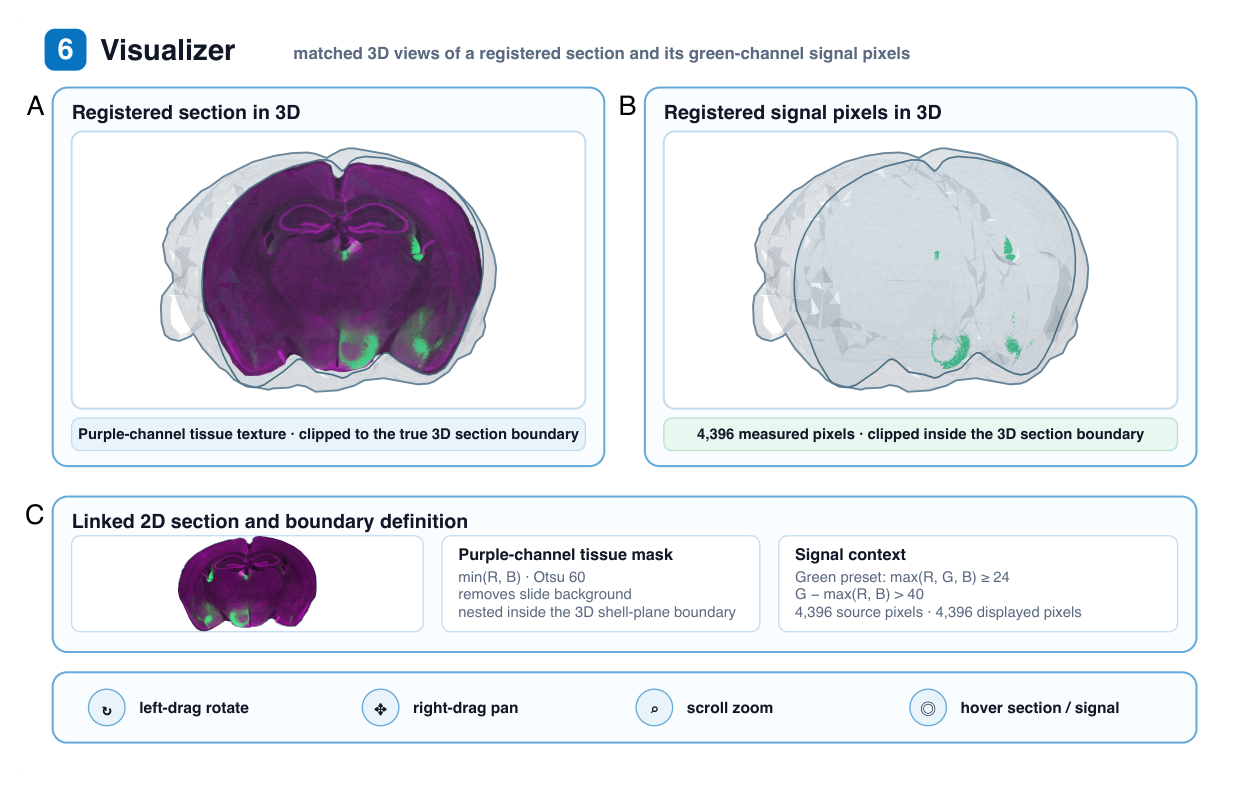
Inspect the result in 3D. The registered section appears as a clipped plane sitting at its true intersection with the actual Allen CCFv3 whole-brain surface, with the measured signal pixels shown in place and a linked 2D view for full context. Rotate, pan, zoom, and hover to explore.
Highlights
Quick start
Click Launch NeuroFlow, load your section images, and follow the stages left to right: Cropper → Arranger → 3D Orienter → Scaler → Quantifier → Analyzer → Visualizer. Everything runs in your browser and your images never leave your computer.